Data & Analytics
Infrastructure that turns scattered data into a single source of truth, executive dashboards and automated reporting.
Technologies we use
What problems do we solve?
If sales and accounting give different numbers to the same question; if the month-end report takes three days of manual assembly; if "same period last year" depends on one person's spreadsheet archive — the data exists, the infrastructure doesn't. We consolidate data from your systems into one source of truth, pin down metric definitions, and turn it into dashboards leadership can trust every morning.
A badly modeled warehouse is paid for over years: slow queries, reports that disagree, query piles nobody dares touch. That's why the real work is in the modeling, not the tooling.
What we build
- Data warehouse setup — on PostgreSQL or BigQuery, with versioned, tested data models in dbt.
- Data collection (ETL/ELT) — monitored pipelines from ERP, e-commerce, CRM and custom systems; ones that tell you when they break.
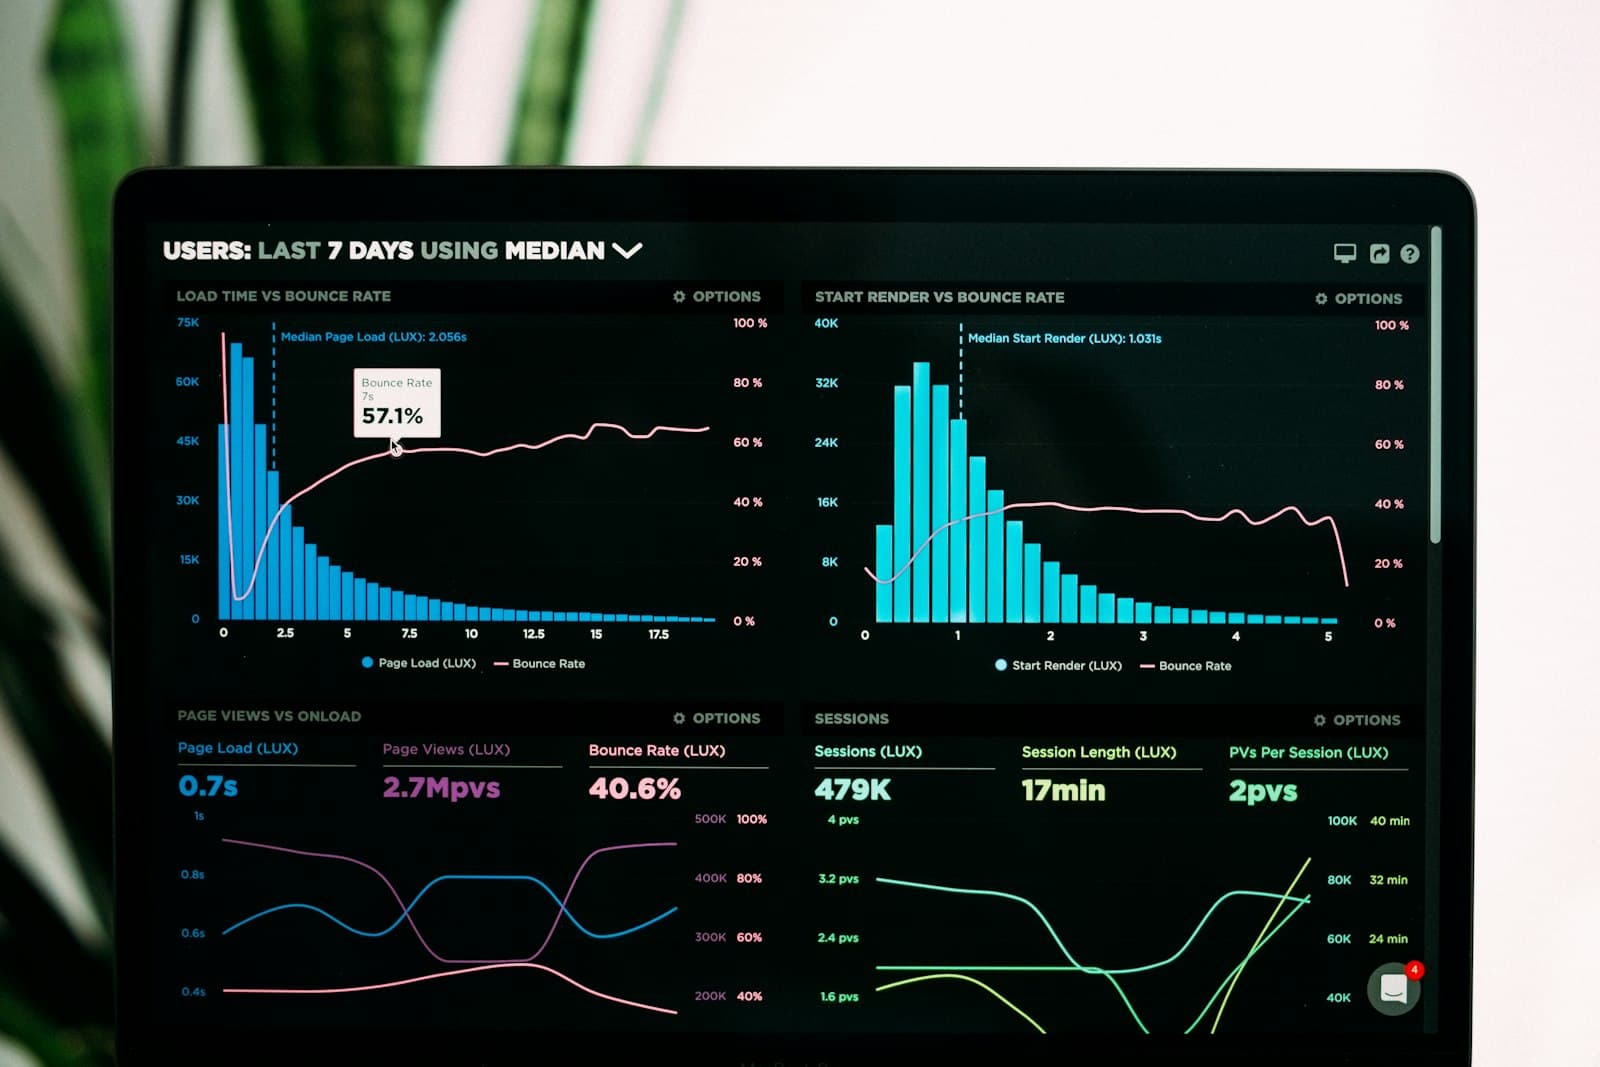
- Executive dashboards — on Metabase or Power BI; sales, stock, finance and operations on one screen.
- A metrics dictionary — one definition of "active customer" and "net revenue"; the document that ends cross-department number fights.
- Data groundwork for AI — the clean foundation assistant and automation projects stand on (see AI & ML).
How we work
- Discovery (1 week) — which decisions need which metrics; inventory of sources and quality issues.
- Modeling (1-2 weeks) — warehouse schema, pipeline design, metric definitions. Deliverables: data dictionary and architecture document.
- Build (3-8 weeks) — pipelines, transformations, quality tests and the first dashboard set. We don't save the first useful dashboard for the end; it's usually on your desk by week 3-4.
- Handover — team training and documentation. The goal: you answer the next question yourself, without calling us.
Frequently asked questions
Can we start from our current spreadsheet setup?
Yes — most projects start exactly there. Spreadsheets connect as the first data source, the infrastructure grows behind them without breaking anyone's routine, and teams move to dashboards as they're ready. Projects that try to change habits in a day die; we migrate gradually.
Which tools do you use? What about license costs?
Our default stack is open-source-heavy: PostgreSQL, dbt, Metabase — zero or low license cost. If your organization lives in Power BI/Microsoft, we build on that instead. Tooling is chosen at discovery based on what you already pay for and what your team knows; we're not selling shelf products.
Will reports still depend on you?
We build so they don't. Dashboards are self-service — filtering, drill-down and export are in your team's hands. Handover includes training and the data dictionary. Need a new metric later? Add it yourself, or bring us back for a small piece of work — you're not locked in.
Our data isn't big — is this still worth it?
The value of a warehouse comes from scatter, not volume. A business with three systems and a few thousand orders a month sees value faster than most "big data" projects. A small setup finishes in 4-6 weeks and scales as you grow.
Tell us which decisions you want backed by data; we'll map the shortest path to your first dashboard.
Have an idea?
30-minute discovery call is free. Let us listen and craft a roadmap together.
Discuss this solution